
The industry transformed, the customer didn’t notice.
We analysed the FCA’s firm-level complaints dataset — all 163 firms reporting insurance and pure protection complaints in the second half of 2025, published 15 May 2026 — to answer a simple question: after five years of claims transformation spend, where is the payoff in the one dataset that measures the customer’s experience?
We could not find it. In the FCA’s own words, complaints have stayed relatively constant between 1.7m and 2.0m since 2021 — through every digital programme, core migration and AI pilot signed off in that period.
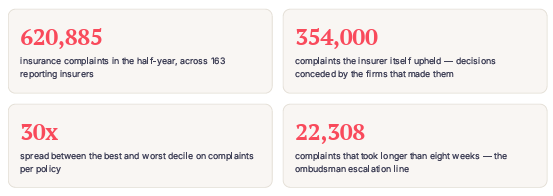
Three findings follow. Complaint volumes are stagnant despite the spend. The spread between insurers is enormous. And when you trace what customers complain about, every major theme resolves to the same root: the claims decision — too slow, inconsistent, or contested — and the silence customers sit in while they wait for it.
Two limitations shape what this data can and cannot tell us, and we would rather state them up front than bury them.
Product mix is not controlled for. The FCA reports complaints for each firm under a single insurance and pure protection heading, without splitting by product line. A firm writing business that rarely generates disputes — parametric cover, for instance — will show well without necessarily operating better. Differences between firms therefore cannot be attributed to operational performance alone.
The denominator is policies, not claims. Complaints arise from claims, but the FCA's context measure expresses them against policies in force. Insurers with lower claim frequency are flattered by that measure. A per-claim rate would be the fairer comparison; it is not published.
Five years, flat.

complaints per half-year, every period since 2021.
The FCA describes its own trend line plainly: since 2021, complaint volumes have stayed relatively constant between 1.7m and 2.0m. Insurance and pure protection — the largest product group — actually fell 4.6% in the latest period, and motor and transport fell 7.8%. Not a crisis. Not an improvement. A flat line.
Set that against what the same five years contained: sustained investment in claims technology across the market. Digital FNOL. Core system replacements. Automation programmes. AI pilots in every major claims function. If that spend had reached the customer, this is the dataset where it would show — fewer customers driven to complain, faster resolutions when they do.
The benchmark question for any claims leader: which number in the FCA’s file did your last transformation programme move — and by how much?
To be precise, stagnation does not imply that claims performance has worsened. Rather, it means that five years of industry-wide transformation has not materially changed the rate at which claims experiences fail badly enough for customers to complain. That does not imply the investment had no effect: some of it may have offset increases in claim volumes and operational complexity that would otherwise have led to poorer outcomes. Nevertheless, from the customer’s perspective, the outcome the industry sought to improve has remained essentially unchanged.
The thirtyfold gap, and the question it raises.
Line up all 163 insurers by the FCA’s per-policy context measure and the spread is the most striking feature of the dataset
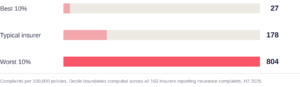
Per 100,000 policies: the best decile generates 27 complaints, the typical insurer 178, the worst decile 804. A thirtyfold spread.
The tempting conclusion is that the leaders have solved a problem the laggards have not. We would caution against that reading on this data alone. As set out on page 2, the FCA does not publish firm complaints split by product line, and it measures against policies rather than claims. A firm at the good end may be running an exceptional claims operation — or writing business that generates few disputes by its nature, or carrying a book with low claim frequency. From the published data, those explanations cannot be separated.
What the spread does establish is something narrower, but more important: differences between insurers are far larger than the changes observed over five years of industry-wide transformation. The data cannot explain those differences, nor should complaint rates per 100,000 policies be interpreted as a direct measure of claims performance. They are shaped by product mix, claims frequency and other structural factors. But they do show that customer outcomes vary markedly across the market. Whatever explains that variation appears to matter far more than the changes delivered by five years of transformation.
Complaint handling speed offers a cleaner view. How quickly a firm resolves a complaint reflects how it is run rather than what it sells, so it is far less exposed to the structural factors above. Here too the variation is wide: the median firm resolves 97.7% of complaints within eight weeks, but 52 firms sit below 95% and 30 below 90%. In total, 22,308 complaints ran past the eight-week line at which a customer may escalate to the Financial Ombudsman — the most expensive complaints an insurer handles
Every complaint theme is a decision problem in disguise.
Around 71% of insurance complaints concern the claim itself — not pricing, not how the policy was sold (analysis of Financial Ombudsman data by Insurance DataLab). Read the ombudsman’s published themes on what those complaints are about, and a pattern emerges that most transformation programmes have missed:
| Claim declined | a decision contested |
| Delays in paying out | a decision not yet made |
| The amount offered | a decision disputed |
| Left in the dark | waiting on a decision |
Every major theme resolves to the claims decision: one the customer disagrees with, one that has not happened yet, or the silence while it is awaited. The complaint is rarely about the digital journey around the decision — which is precisely the part the last five years digitised.
Complaints in one half-year where the insurer itself agreed the customer was right.
Applying each firm’s published uphold rate to its published volumes gives roughly 354,000 complaints upheld in the customer’s favour (57%) by the firm that made the original decision. These are not chancers or fine judgement calls — they are decisions that were wrong, inconsistent between handlers, or simply too slow, conceded by the insurers who made them. At this scale, decision quality and decision speed are not an edge case.
They are the industry’s largest self-admitted failure mode — and unlike the per-policy spread, this measure does not depend on product mix at all.
The reframe — Why AI alone has not closed the gap.

A claim is a series of decisions, and the waiting between them. Five years of transformation digitised the journey and left both problems standing: decisions that are slow and inconsistent, and silence in between.
AI was supposed to solve the first. Largely, it has not — and the reason is structural rather than technical. Today’s models are exceptionally good at analysing evidence and predicting a likely outcome. But a prediction is a probability, and a probability still requires a human to confirm it is technically correct before it can be acted on. The handler spends less time gathering and the same time deciding. The bottleneck the technology was bought to remove is still there, and so is the inconsistency between handlers that drives leakage and disputes.
Regulation compounds it. Under Consumer Duty, and with growing scrutiny of automated decision-making, a decision an insurer cannot explain is a decision it cannot safely automate. Models that produce a recommendation without a defensible account of how they reached it push work back to human review by design.
What the industry actually needs
Not better AI prediction — but explainable, technically-correct decisioning. Rather than selecting the most likely outcome, the alternative is to eliminate every outcome the evidence and the business rules cannot support, until only the technically admissible decision remains. There is nothing left to approve, because nothing else survived. The same claim produces the same outcome regardless of who is on shift, and the reasoning behind it can be produced on demand for a customer or a regulator.
This is the work Claim Technology exists to do. Our patent-pending Geometric Decisions engine reaches decisions by elimination rather than prediction — explainable, repeatable and defensible by construction. Alongside it we embed intake, assessment and customer communication into the systems insurers already run, live in weeks rather than years.
If it is useful, we will happily show any claims leader where their own operation sits against the 163 firms in this analysis. hello@claimtechnology.co.uk
How this analysis was built.
Primary dataset. FCA firm-level complaints data, published 15 May 2026 under the Open Government Licence, covering the reporting period 1 July – 31 December 2025 and reflecting the FCA’s May 2026 revision. Our analysis covers all 163 firms reporting complaints in the insurance and pure protection product group.
Measures used. Complaint volumes (opened); the FCA’s per-policy context measure (complaints per 1,000 policies, scaled here to per 100,000 for readability); the share of complaints closed within eight weeks; and the share upheld by the firm. Decile boundaries, medians and totals are computed by Claim Technology directly from the published file.
Key computed figures. Median 1.78 complaints per 1,000 policies; 97.7% eight-week closure; 47% median firm upheld rate. Decile boundaries 0.27 (best) and 8.04 (worst) per 1,000 policies. Estimated complaints upheld (~354,000) and complaints exceeding eight weeks (22,308) are computed by applying each firm’s published rates to its published volumes; the volume-weighted uphold rate is higher than the median firm rate because larger firms uphold a greater share.
Limitations we would want a reader to weigh
Product mix is not controlled for. The FCA publishes firm complaints under a single insurance and pure protection heading. Differences between firms may reflect the type of business written rather than operational performance, and the two cannot be separated from published data. Comparisons between individual firms should be treated with corresponding caution.
Policies, not claims, are the denominator. Complaints arise in the context of claims. Expressing them against policies in force understates the true rate and flatters insurers with lower claim frequency. A per-claim measure would be fairer but is not published at firm level.
Complaints show where friction surfaces, not why. This is a directional benchmark, not a verdict on any firm. No individual insurer is named. Some UK branches of EEA firms are not required to publish, so absence of data is not a signal.
Secondary sources. The share of insurance complaints relating to claims (~71%) draws on published analysis of Financial Ombudsman Service data by Insurance DataLab. Complaint-cause themes draw on FOS published commentary. Industry-level volume trends quote the FCA’s own summary of its aggregate data.
About Claim Technology
Claim Technology helps insurers, MGAs, TPAs and Brokers re-imagine claims. Our no-code/low-code design studio, cloud-apps and insurtech APIs empowers operations and IT teams to rapidly automate in the cloud, with plugins to a marketplace of 70 AI insurtechs. To learn more contact us at hello@claimtechnology.co.uk or find us on LinkedIn.


